Select Agriculture Production (1889)
The commodities of cotton, tobacco and sorghum were extracted from the US Department of Agriculture census data from 1889, and then curated by A.Miller. The maps shows the production of each commodity as designated below. To read more about other agriculture that developed in Tennessee, visit the Agriculture theme. For all three maps, please note: No census data was available for Alaska and Hawaii in 1889 and therefore are not represented in these graphs.
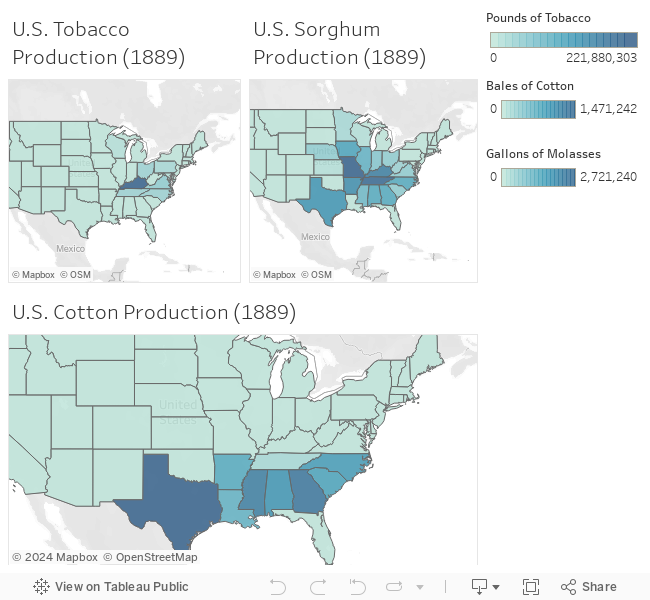
U.S. Cotton Production (1889)
This graph represents the production of cotton. The colors represent the number of bales of cotton produced. The darker the shade of blue, the higher number of bales. Hover over each state to also see the number of acres of cotton.
U.S. Tobacco Production (1889)
This graph represents the production of tobacco. The colors represent the number of pounds of tobacco produced. The darker the shade of blue, the higher number of pounds. Hover over each state to also see the number of acres of tobacco. Note: Montana and Arizona had less than one acre but more than zero acres. For simplicity in this graph, these two states are listed with one acre.
U.S. Sorghum Production (1889)
This graph represents the production of sorghum. The colors represent the number of gallons of molasses produced. The darker the shade of blue, the higher number of gallons. Hover over each state to also see the number of acres of sorghum.