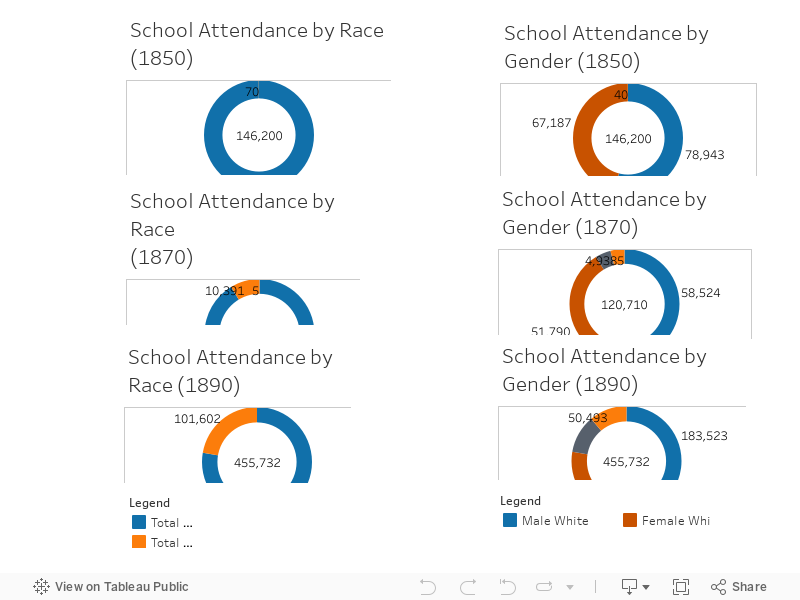
Among the observations from these ring charts, there is a noticeable decrease in the total student population from 1850 (146,200) to 1870 (120,710). The numbers are based on the US Census county data for the identified years, made available by the Census via the Social Explorer Dataset (hover over the ring chart sections to see the corresponding population). Although there was an increase in the number of counties in Tennessee from 1850 (79) to 1870 (85), what transformations were taking place in the Tennessee landscape or economy that could have triggered a drop in school attendance? As you research this, keep in mind that census data records could be an issue.
Now consider the increase in school attendance from 1870 (120,710) to 1890 (455,732); a period which also gained more counties putting 1890 at 96 total counties. What could have made this jump in attendance? On the Tennessee Population graph, there is a large population spike that could be explored; the 1867 mandate of opening public education to all children; or any of the reasons listed in the 1870-1913 section of the essay on Public Education. These school attendance graphs not only beg these questions but probe many others.
Tennessee School Attendance was extracted, cleaned and curated by A.Miller and visualized in Tableau.
Note: Best viewed on desktop or tablet.